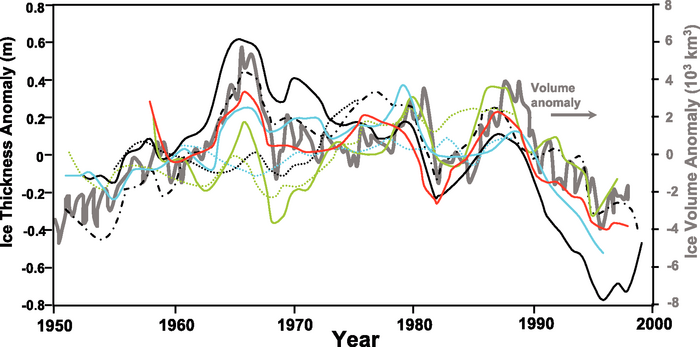
Figure 4.11. Comparison of model-based time series of the annual mean average sea ice thickness anomaly (computed relative to the mean of the entire period) in the Arctic Basin, obtained from a variety of models (redrafted from Rothrock et al., 2003; see this paper for identification of the individual models and their attributes), along with the sea ice volume anomalies in the Arctic Basin (grey curve and right-hand scale; computed by Koeberle and Gerdes, 2003).