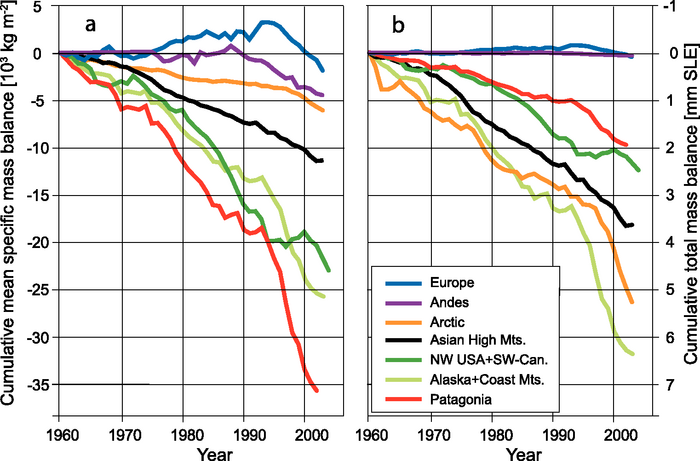
Figure 4.15. Cumulative mean specific mass balances (a) and cumulative total mass balances (b) of glaciers and ice caps, calculated for large regions (Dyurgerov and Meier, 2005). Mean specific mass balance shows the strength of climate change in the respective region. Total mass balance is the contribution from each region to sea level rise.