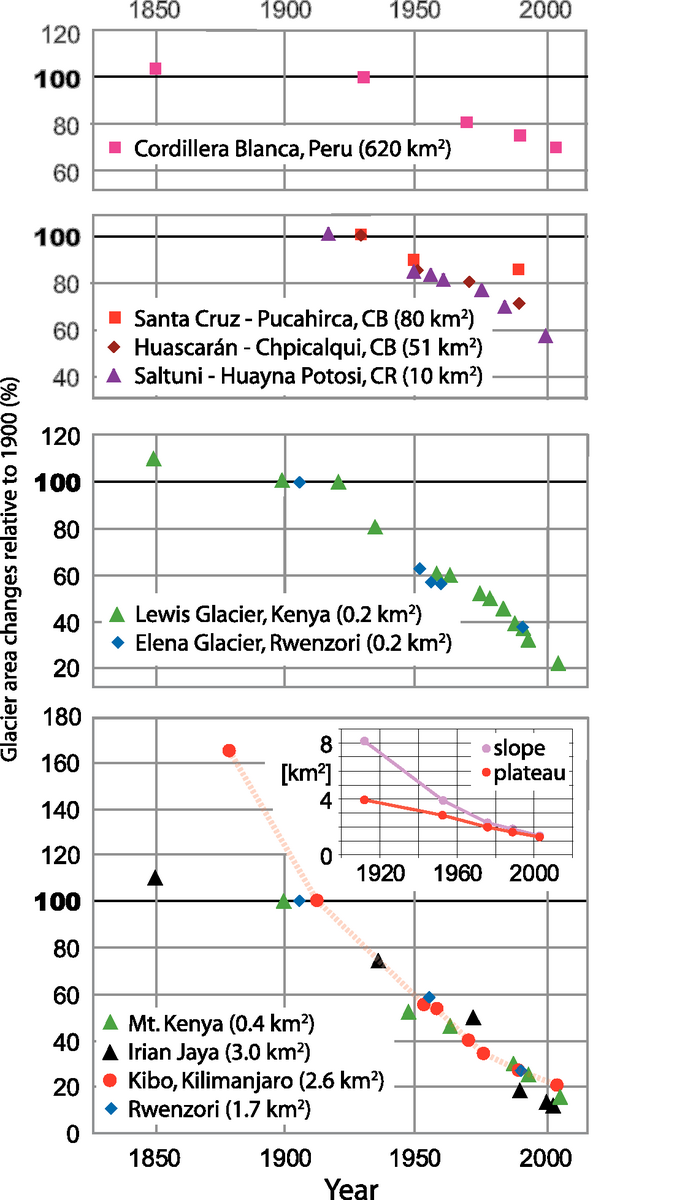
Figure 4.16. Changes in the surface area of tropical glaciers relative to their extent around 1900, grouped according to different glacier sizes. The sizes are given for 1990 or the closest available date to 1990. The broken red line highlights the retreat of Kilimanjaro glaciers. The insert shows the area change (km2) of the Kilimanjaro plateau (red) and slope (purple) glaciers as separated by the 5,700 m contour line (Kaser and Osmaston, 2002 (updated courtesy of S. Lieb); Mölg et al., 2003b; Georges, 2004; Hastenrath, 2005; Cullen et al., 2006; Klein and Kincaid, 2006).