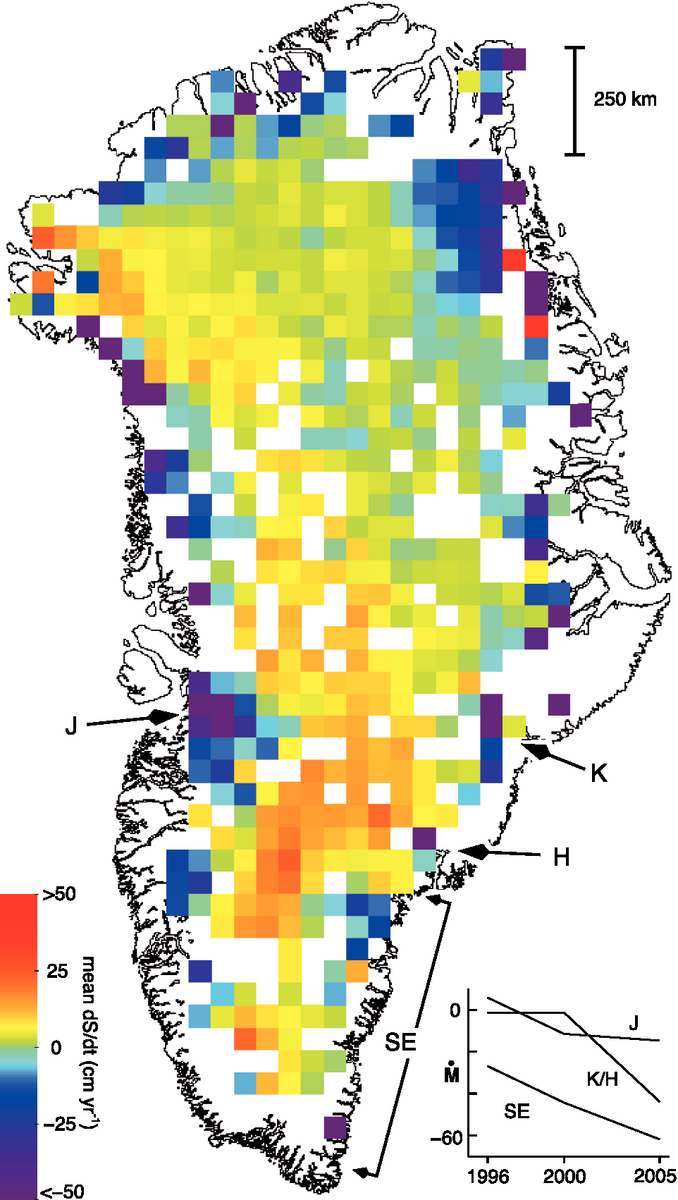
Figure 4.17. Rates of surface elevation change (dS/dt) derived from laser altimeter measurements at more than 16,000 locations on the Greenland Ice Sheet where ICESat data from 2005 overlay aircraft surveys in 1998/1999 (using methods described by Thomas et al., 2006). Locations of rapidly thinning outlet glaciers at Jakobshavn (J), Kangerdlugssuaq (K), Helheim (H) and along the southeast coast (SE) are shown, together with an inset showing their estimated total mass balance (M∙ , Gt yr–1) between 1996 and 2005 (Rignot and Kanagaratnam, 2006).