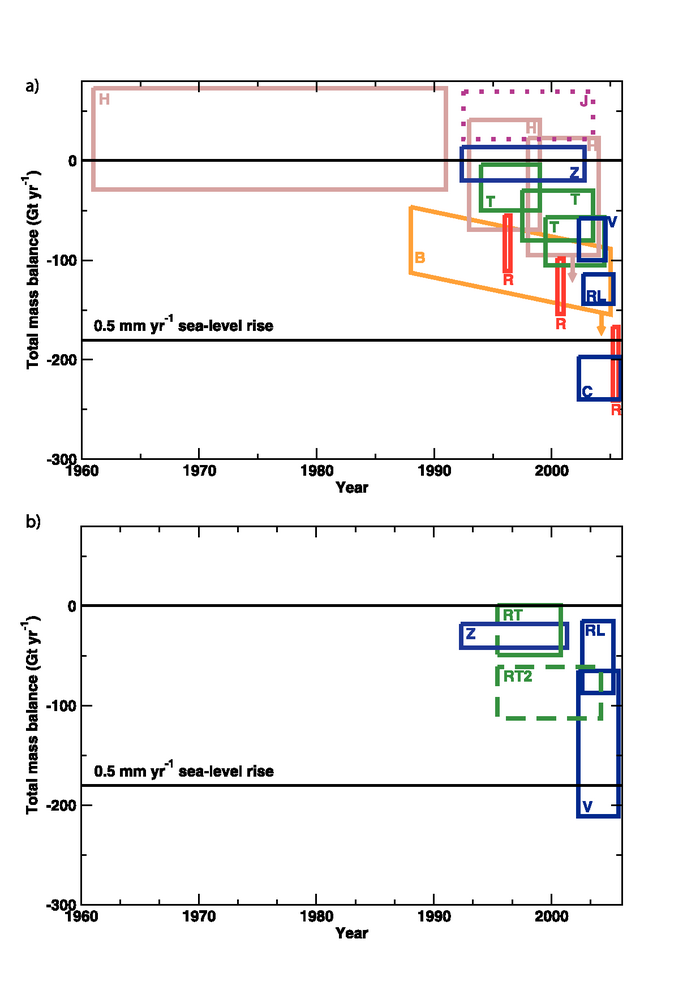
Figure 4.18. (Top) Mass balance estimates for Greenland. The coloured rectangles, following Thomas et al. (2006), indicate the time span over which the measurements apply and the estimated range, given as (mean + uncertainty) and (mean – uncertainty) as reported in the original papers. Code: B (orange; Box et al, 2006), surface mass balance, using stated trend in accumulation, ice flow discharge (assumed constant), and standard error on regression of accumulation trend, with added arrow indicating additional loss from ice flow acceleration; H (brown; Hanna et al., 2005), surface mass balance, with arrow as for B; T (dark green; Thomas et al., 2006), laser altimetry, showing new results and revision of Krabill et al. (2004) to include firn densification changes; Z (violet; Zwally et al., 2006), primarily radar altimetry, with uncertainty reflecting the difference between a thickness change due to ice everywhere and that due to low-density firn in the accumulation zone; R (red; Rignot and Kanagaratnam, 2006), ice discharge combined with surface mass balance; V (blue; Velicogna and Wahr, 2005) GRACE gravity; RL (blue; Ramillen et al., 2006) GRACE gravity; J (magenta dashed; Johannessen et al., 2005), radar altimetry without firn densification correction and applying only to central regions that are thickening but omitting thinning of coastal regions. (Bottom) Mass balance estimates for grounded ice of Antarctica. Coloured rectangles show age span and error range as in the top panel. Code: Z (violet; Zwally et al., 2006), radar altimetry, with uncertainty reflecting the difference between a thickness change due to ice everywhere and that due to low-density firn everywhere; RT (dark green; Rignot and Thomas, 2002), ice discharge and surface mass balance, with dashed end line because some of the accumulation rate data extend beyond the time limits shown; RT2 (dark green; Rignot and Thomas, 2002), updated to include additional mass losses indicated by Thomas et al. (2004) and Rignot et al. (2005), dashed because the original authors did not produce this as an estimate for the whole ice sheet nor are accumulation rates updated; V (blue; Velicogna and Wahr, 2006), GRACE gravity; RL (blue; Ramillen et al., 2006), GRACE gravity.