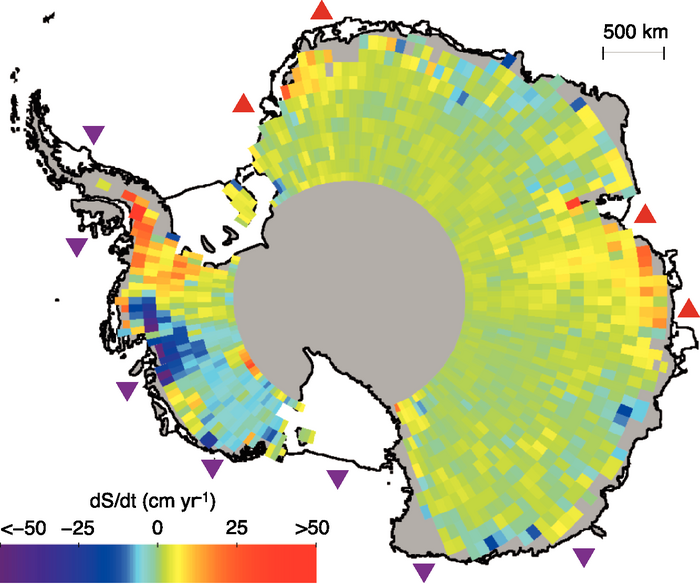
Figure 4.19. Rates of surface elevation change (dS/dt) derived from ERS radar-altimeter measurements between 1992 and 2003 over the Antarctic Ice Sheet (Davis et al., 2005). Locations of ice shelves estimated to be thickening or thinning by more than 30 cm yr–1 (Zwally et al., 2006) are shown by red triangles (thickening) and purple triangles (thinning).