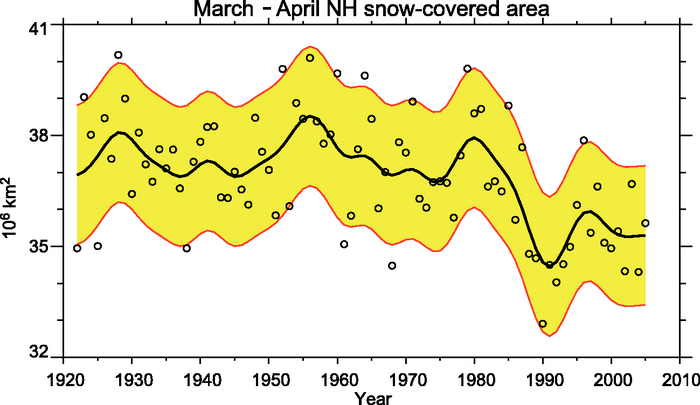
Figure 4.2. Update of NH March-April average snow-covered area (SCA) from Brown (2000). Values of SCA before 1972 are based on the station-derived snow cover index of Brown (2000); values beginning in 1972 are from the NOAA satellite data set. The smooth curve shows decadal variations (see Appendix 3.A ), and the shaded area shows the 5 to 95% range of the data estimated after first subtracting the smooth curve.