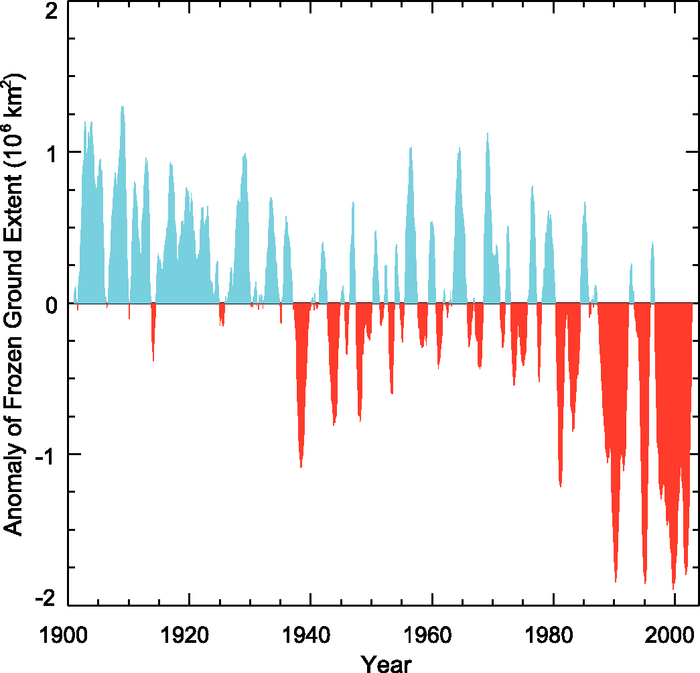
Figure 4.22. Historical variations in the monthly areal extent (106 km2) of seasonally frozen ground (including the active layer over permafrost) for the period from 1901 through 2002 in the NH. The positive anomaly (blue) represents above-average monthly extent, while the negative anomaly (red) represents below-average extent. The time series is smoothed with a low-pass filter (after Zhang et al., 2003).