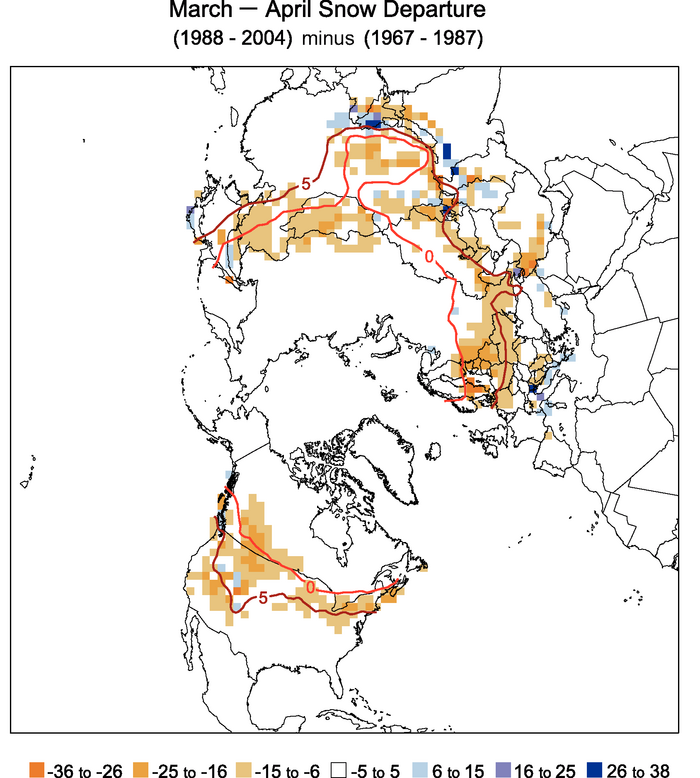
Figure 4.3. Differences in the distribution of Northern Hemisphere March-April average snow cover between earlier (1967–1987) and later (1988–2004) portions of the satellite era (expressed in % coverage). Negative values indicate greater extent in the earlier portion of the record. Extents are derived from NOAA/NESDIS snow maps. Red curves show the 0°C and 5°C isotherms averaged for March and April 1967 to 2004, from the Climatic Research Unit (CRU) gridded land surface temperature version 2 (CRUTEM2v) data.