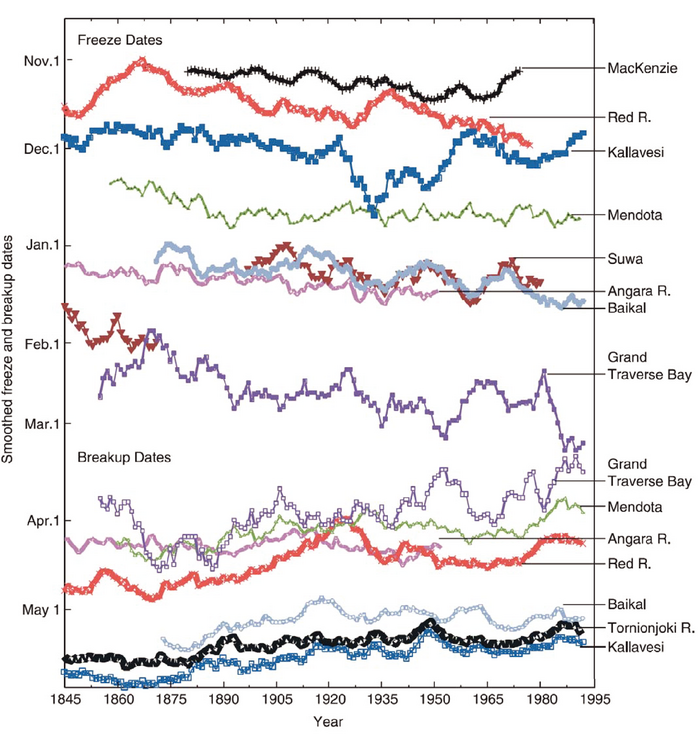
Figure 4.5. Time series of freeze-up and breakup dates from several northern lakes and rivers (reprinted with permission from Magnuson et al., 2000, copyright AAAS). Dates have been smoothed with a 10-year moving average. See the cited publication for locations and other details.