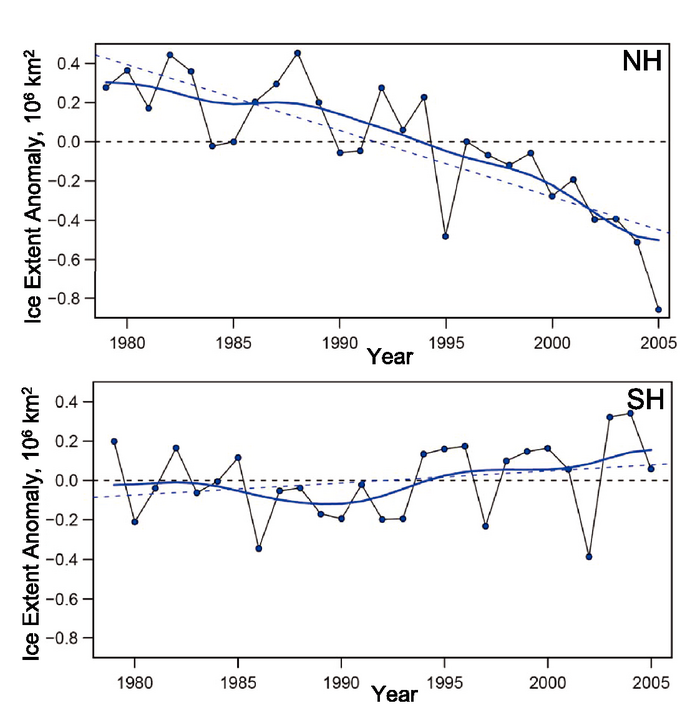
Figure 4.8. Sea ice extent anomalies (computed relative to the mean of the entire period) for (a) the NH and (b) the SH, based on passive microwave satellite data. Symbols indicate annual mean values while the smooth blue curves show decadal variations (see Appendix 3.A ). Linear trend lines are indicated for each hemisphere. For the Arctic, the trend is –33 ± 7.4 × 10³ km2 yr–1 (equivalent to approximately –2.7% per decade), whereas the Antarctic results show a small positive trend of 5.6 ± 9.2 × 10³ km2 yr–1. The negative trend in the NH is significant at the 90% confidence level whereas the small positive trend in the SH is not significant (updated from Comiso, 2003).