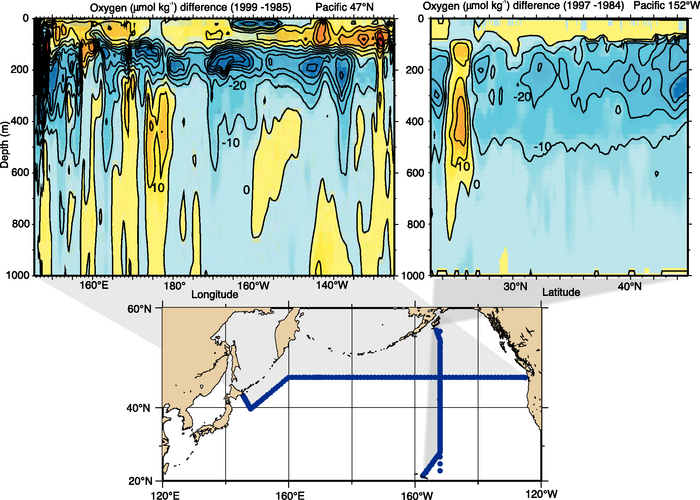
Figure 5.12. Changes in oxygen concentration (μmol kg–1) along two sections in the North Pacific (see map, bottom panel). Top left panel: Difference (1999 minus 1985) along 47°N. Top right panel: Difference (1997 minus 1984) at 152°W. Blue colours indicate a decrease and yellow colours indicate an increase in oxygen over time. The differences were calculated using density as the vertical coordinate. After Deutsch et al. (2005).