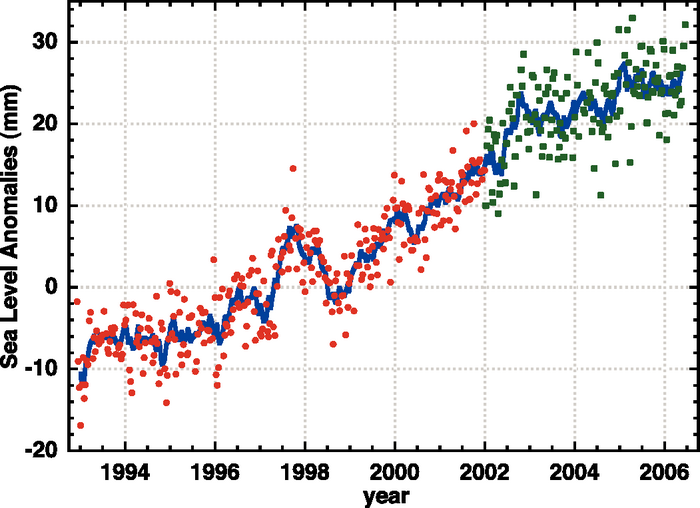
Figure 5.14. Variations in global mean sea level (difference to the mean 1993 to mid-2001) computed from satellite altimetry from January 1993 to October 2005, averaged over 65°S to 65°N. Dots are 10-day estimates (from the TOPEX/Poseidon satellite in red and from the Jason satellite in green). The blue solid curve corresponds to 60-day smoothing. Updated from Cazenave and Nerem (2004) and Leuliette et al. (2004).