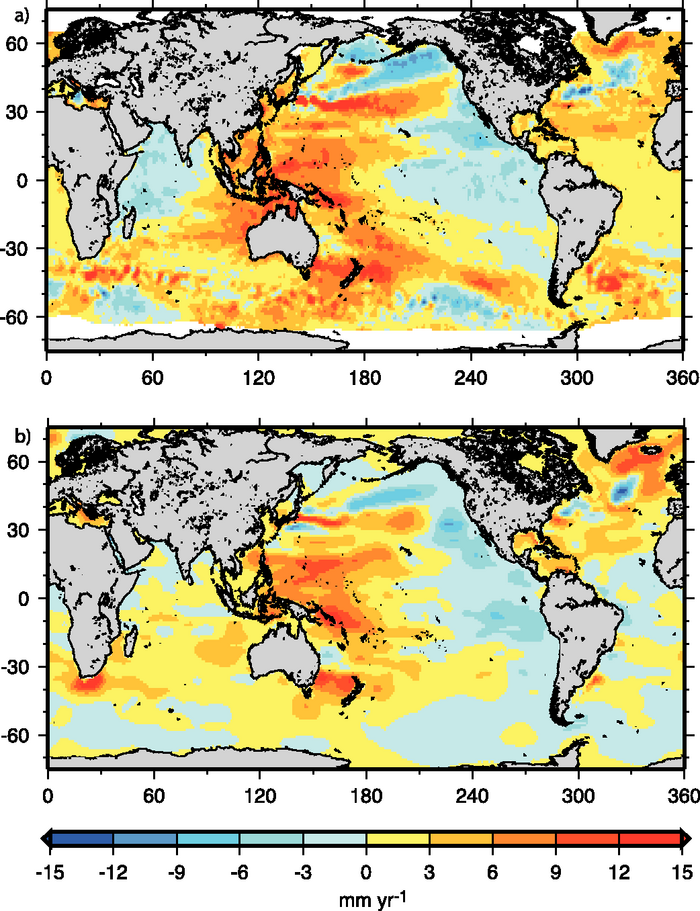
Figure 5.15. (a) Geographic distribution of short-term linear trends in mean sea level (mm yr–1) for 1993 to 2003 based on TOPEX/Poseidon satellite altimetry (updated from Cazenave and Nerem, 2004) and (b) geographic distribution of linear trends in thermal expansion (mm yr–1) for 1993 to 2003 (based on temperature data down to 700 m from Ishii et al., 2006).