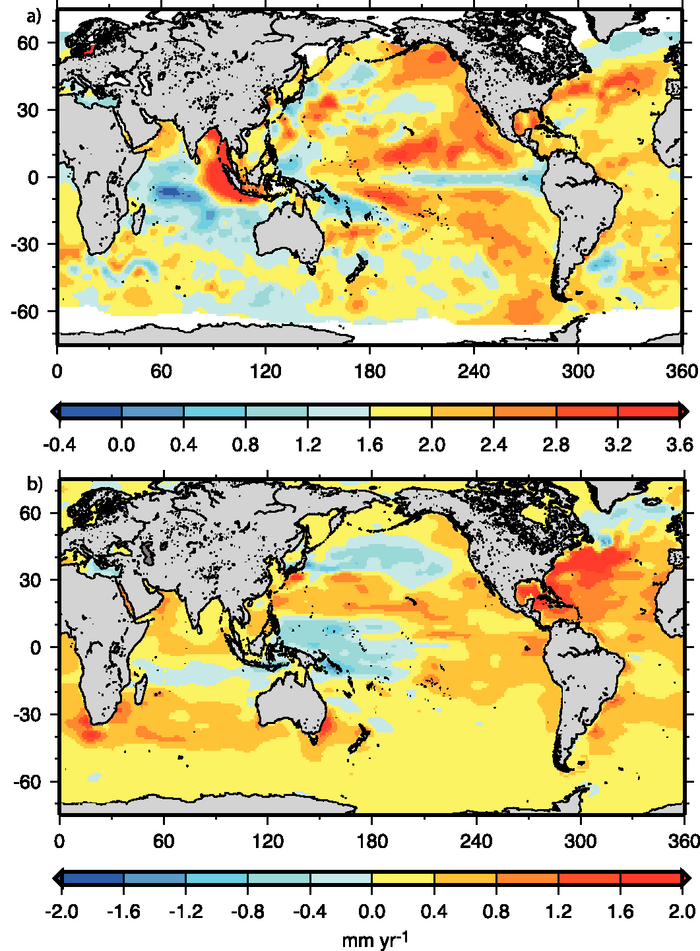
Figure 5.16. (a) Geographic distribution of long-term linear trends in mean sea level (mm yr–1) for 1955 to 2003 based on the past sea level reconstruction with tide gauges and altimetry data (updated from Church et al., 2004) and (b) geographic distribution of linear trends in thermal expansion (mm yr–1) for 1955 to 2003 (based on temperature data down to 700 m from Ishii et al., 2006). Note that colours in (a) denote 1.6 mm yr–1 higher values than those in (b).