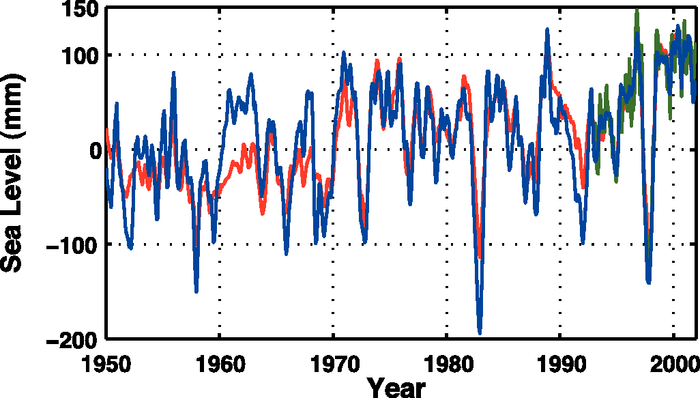
Figure 5.18. Monthly mean sea level curve for 1950 to 2000 at Kwajalein (8°44’N, 167°44’E). The observed sea level (from tide gauge measurements) is in blue, the reconstructed sea level in red and the satellite altimetry record in green. Annual and semi-annual signals have been removed from each time series and the tide gauge data have been smoothed. The figure was drawn using techniques in Church et al. (2004) and Church and White (2006).