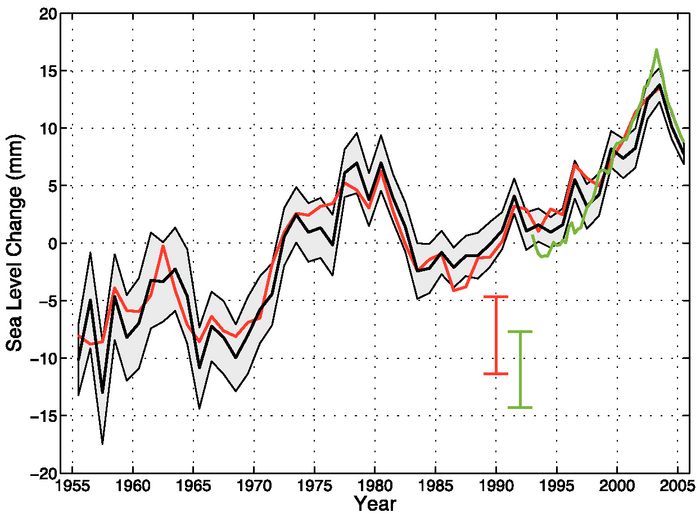
Figure 5.19. Global sea level change due to thermal expansion for 1955 to 2003, based on Levitus et al. (2005a; black line) and Ishii et al. (2006; red line) for the 0 to 700 m layer, and based on Willis et al. (2004; green line) for the upper 750 m. The shaded area and the vertical red and green error bars represent the 90% confidence interval. The black and red curves denote the deviation from their 1961 to 1990 average, the shorter green curve the deviation from the average of the black curve for the period 1993 to 2003.