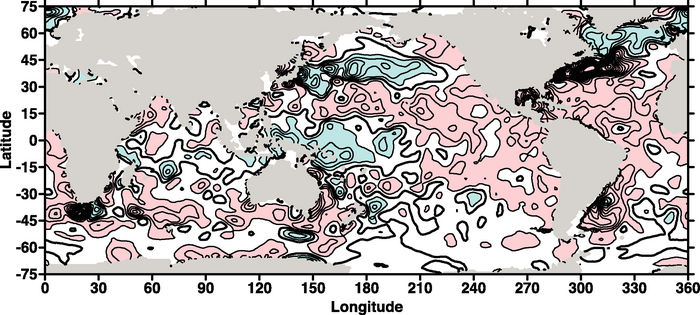
Figure 5.2. Linear trends (1955–2003) of change in ocean heat content per unit surface area (W m–2) for the 0 to 700 m layer, based on the work of Levitus et al. (2005a). The linear trend is computed at each grid point using a least squares fit to the time series at each grid point. The contour interval is 0.25 W m–2. Red shading indicates values equal to or greater than 0.25 W m–2 and blue shading indicates values equal to or less than –0.25 W m–2.