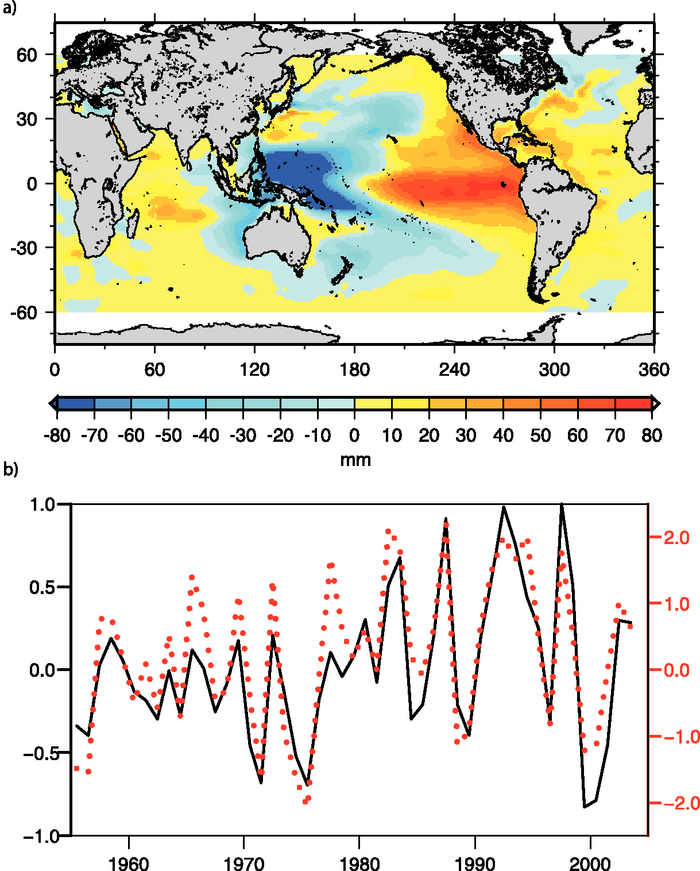
Figure 5.20. (a) First mode of the EOF decomposition of the gridded thermosteric sea level time series of yearly temperature data down to 700 m from Ishii et al. (2006). (b) The normalised principal component (black solid curve) is highly correlated with the negative Southern Oscillation Index (dotted red curve).