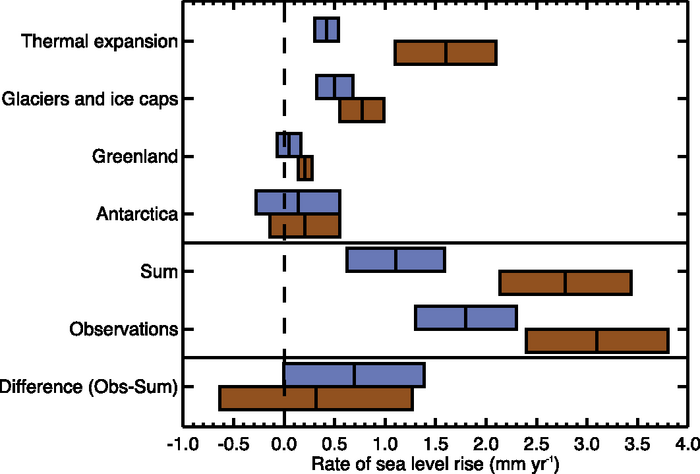
Figure 5.21. Estimates of the various contributions to the budget of the global mean sea level change (upper four entries), the sum of these contributions and the observed rate of rise (middle two), and the observed rate minus the sum of contributions (lower), all for 1961 to 2003 (blue) and 1993 to 2003 (brown). The bars represent the 90% error range. For the sum, the error has been calculated as the square root of the sum of squared errors of the contributions. Likewise the errors of the sum and the observed rate have been combined to obtain the error for the difference.