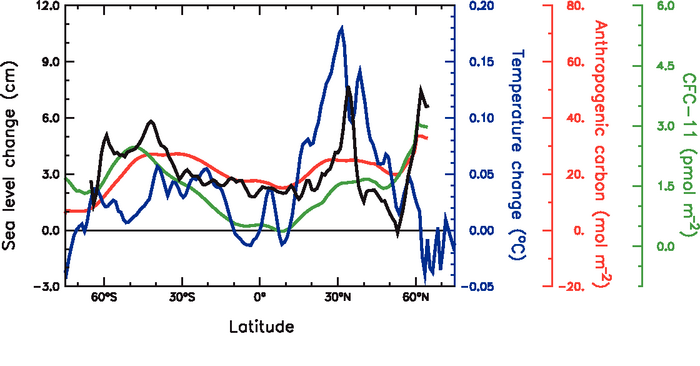
Figure 5.22. Averages of temperature change (blue, from Levitus et al., 2005a), anthropogenic carbon (red, from Sabine et al., 2004b) and CFC-11 (green, from Willey et al., 2004) along lines of constant latitude over the top 700-m layer of the upper ocean. Also shown is sea level change averaged along lines of constant latitude (black, from Cazenave and Nerem, 2004). The temperature changes are for the 1955 to 2003 period, the anthropogenic carbon is since pre-industrial times (i.e., 1750), CFC-11 concentrations are for the period 1930 to 1994 and sea level for the period 1993 to 2003.