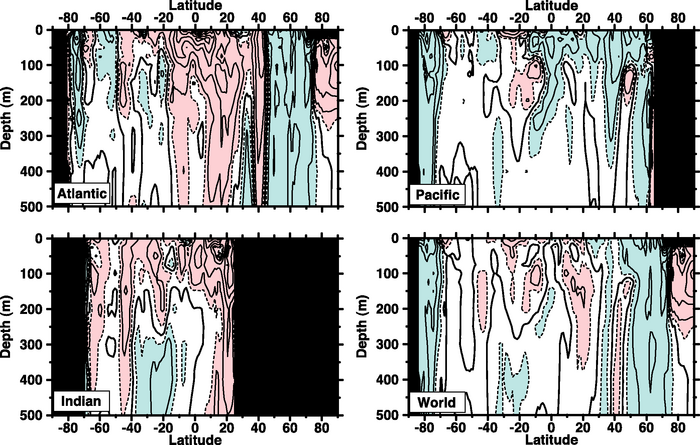
Figure 5.5: Linear trends (1955–1998) of zonally averaged salinity (psu) in the upper 500 m of the Atlantic, Pacific, Indian and World Oceans. The contour interval is 0.01 psu per decade and dashed contours are ±0.005 psu per decade. The dark solid line is the zero contour. Red shading indicates values equal to or greater than 0.005 psu per decade and blue shading indicates values equal to or less than –0.005 psu per decade. Based on the work of Boyer et al. (2005).