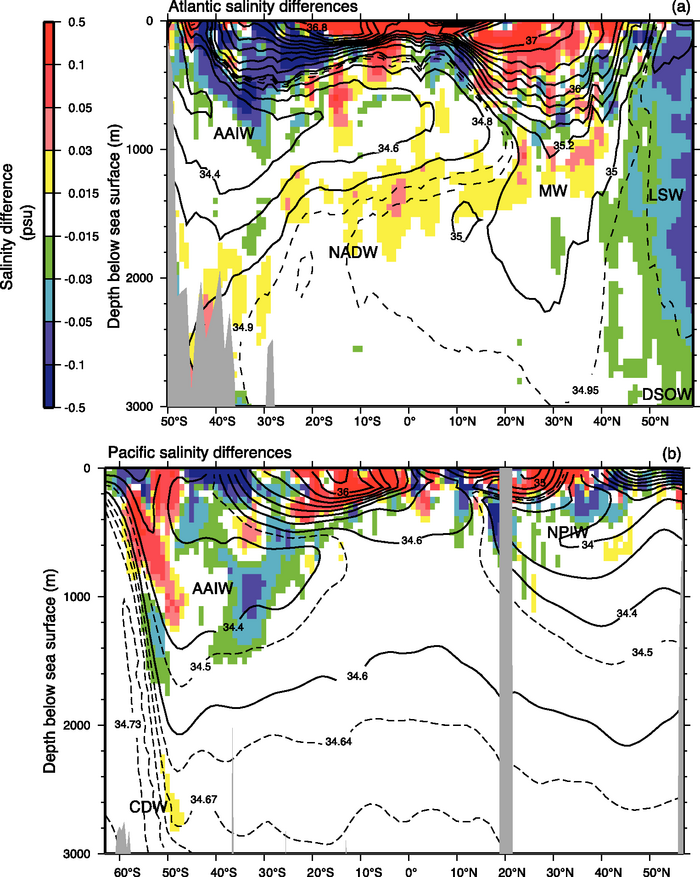
Figure 5.6. Meridional sections of differences in salinity (psu) of the a) Atlantic Ocean for the period 1985 to 1999 minus 1955 to 1969 and b) Pacific Ocean for the World Ocean Circulation Experiment (WOCE) 150°W section (1991–1992) and historical data from 1968 plus or minus 7.5 years. Contours are the mean salinity fields along each section and show the key features. The salinity differences are differences along isopycnals that have been mapped to pressure surfaces. The Atlantic section is along the western side of the Atlantic Ocean and the Pacific section is along 150°W. The two figures are redrafted from Curry et al. (2003) and Wong et al (2001). Water masses shown include Antarctic Intermediate Water (AAIW), Circumpolar Deep Water (CDW), North Atlantic Deep Water (NADW), Mediterranean Water (MW), Labrador Sea Water (LSW), Denmark Strait Overflow Water (DSOW) and North Pacific Intermediate Water NPIW). The areas shaded in grey represent the seafloor and oceanic crust.