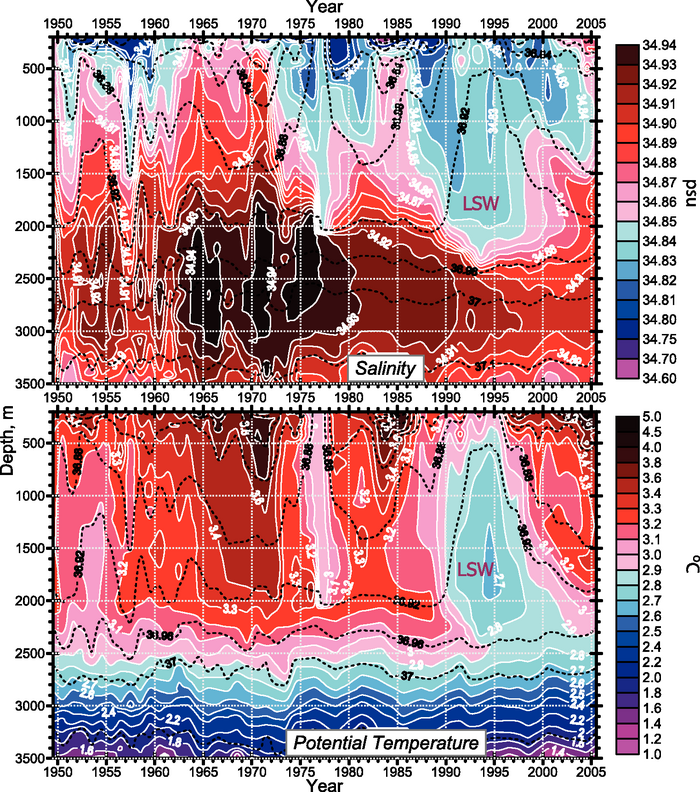
Figure 5.7. The longest available time series of salinity (psu; upper panel) and potential temperature (°C, lower panel) in the central Labrador Sea from 1949 to 2005 (updated from Yashayaev et al., 2003). The dashed lines are contours of potential density (kg m-3, difference from 1,000 kg m-3) and are the same on both panels.