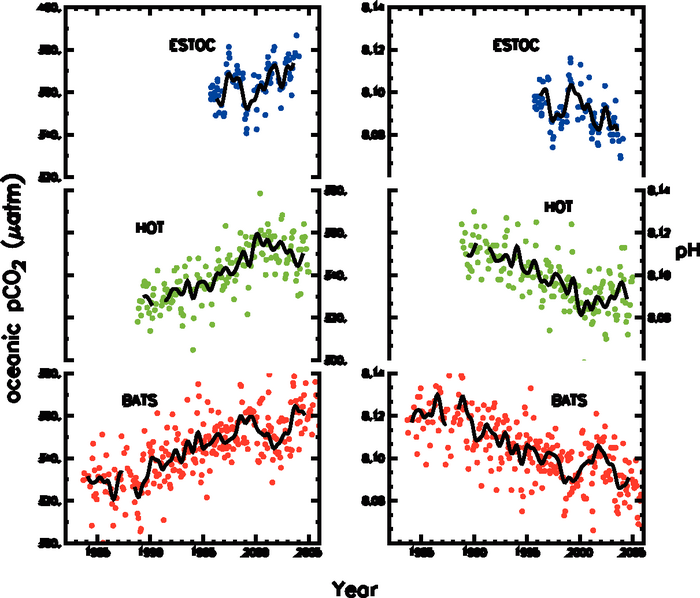
Figure 5.9. Changes in surface oceanic pCO2 (left; in μatm) and pH (right) from three time series stations: Blue: European Station for Time-series in the Ocean (ESTOC, 29°N, 15°W; Gonzalez-Dávila et al., 2003); green: Hawaii Ocean Time-Series (HOT, 23°N, 158°W; Dore et al., 2003); red: Bermuda Atlantic Time-series Study (BATS, 31/32°N, 64°W; Bates et al., 2002; Gruber et al., 2002). Values of pCO2 and pH were calculated from DIC and alkalinity at HOT and BATS; pH was directly measured at ESTOC and pCO2 was calculated from pH and alkalinity. The mean seasonal cycle was removed from all data. The thick black line is smoothed and does not contain variability less than 0.5 years period.