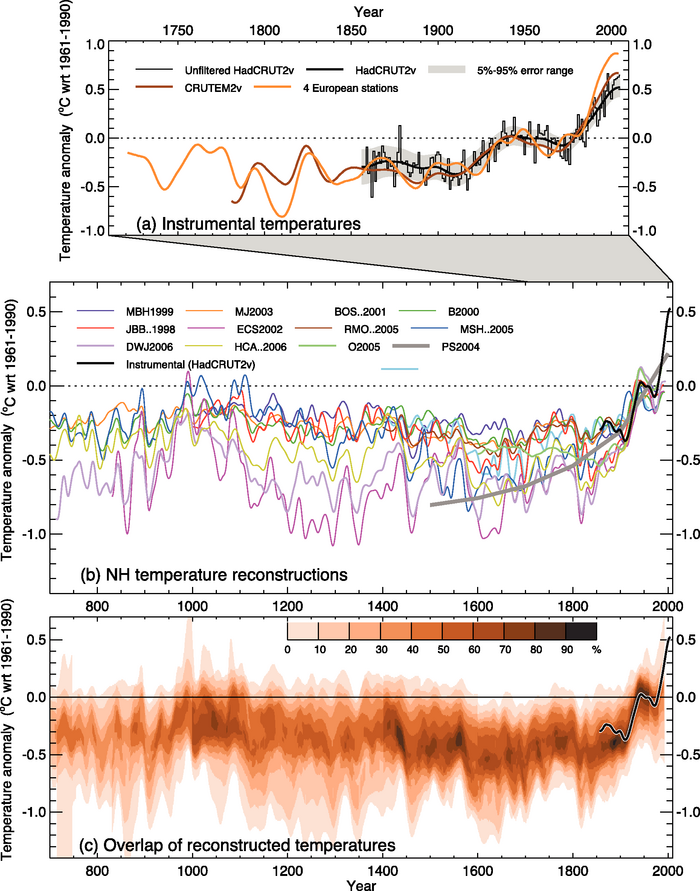
Figure 6.10. Records of NH temperature variation during the last 1.3 kyr. (a) Annual mean instrumental temperature records, identified in Table 6.1 . (b) Reconstructions using multiple climate proxy records, identified in Table 6.1 , including three records (JBB..1998, MBH..1999 and BOS..2001) shown in the TAR, and the HadCRUT2v instrumental temperature record in black. (c) Overlap of the published multi-decadal time scale uncertainty ranges of all temperature reconstructions identified in Table 6.1 (except for RMO..2005 and PS2004), with temperatures within ±1 standard error (SE) of a reconstruction ‘scoring’ 10%, and regions within the 5 to 95% range ‘scoring’ 5% (the maximum 100% is obtained only for temperatures that fall within ±1 SE of all 10 reconstructions). The HadCRUT2v instrumental temperature record is shown in black. All series have been smoothed with a Gaussian-weighted filter to remove fluctuations on time scales less than 30 years; smoothed values are obtained up to both ends of each record by extending the records with the mean of the adjacent existing values. All temperatures represent anomalies (°C) from the 1961 to 1990 mean.