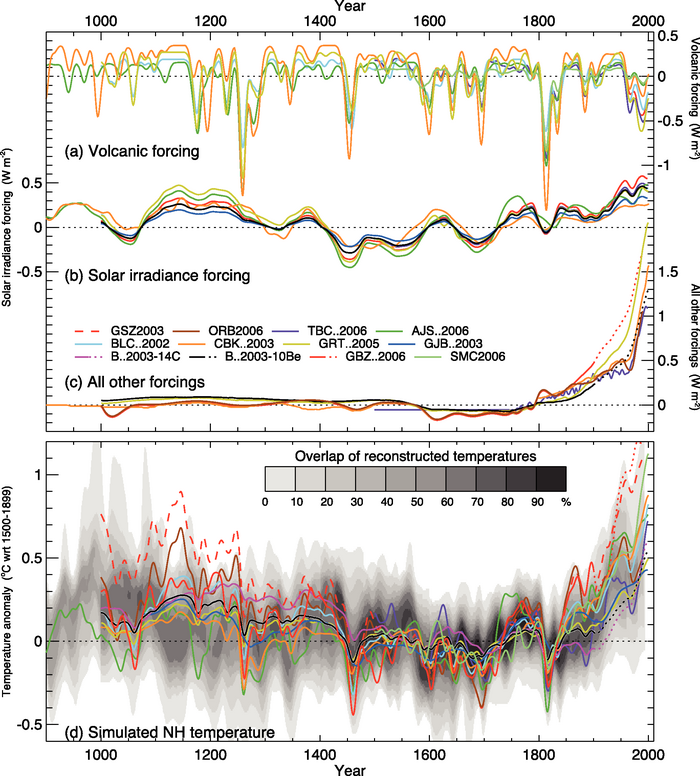
Figure 6.13. Radiative forcings and simulated temperatures during the last 1.1 kyr. Global mean radiative forcing (W m–2) used to drive climate model simulations due to (a) volcanic activity, (b) solar irradiance variations and (c) all other forcings (which vary between models, but always include greenhouse gases, and, except for those with dotted lines after 1900, tropospheric sulphate aerosols). (d) Annual mean NH temperature (°C) simulated under the range of forcings shown in (a) to (c), compared with the concentration of overlapping NH temperature reconstructions (shown by grey shading, modified from Figure 6.10c to account for the 1500 to 1899 reference period used here). All forcings and temperatures are expressed as anomalies from their 1500 to 1899 means and then smoothed with a Gaussian-weighted filter to remove fluctuations on time scales less than 30 years; smoothed values are obtained up to both ends of each record by extending the records with the mean of the adjacent existing values. The individual series are identified in Table 6.2 .