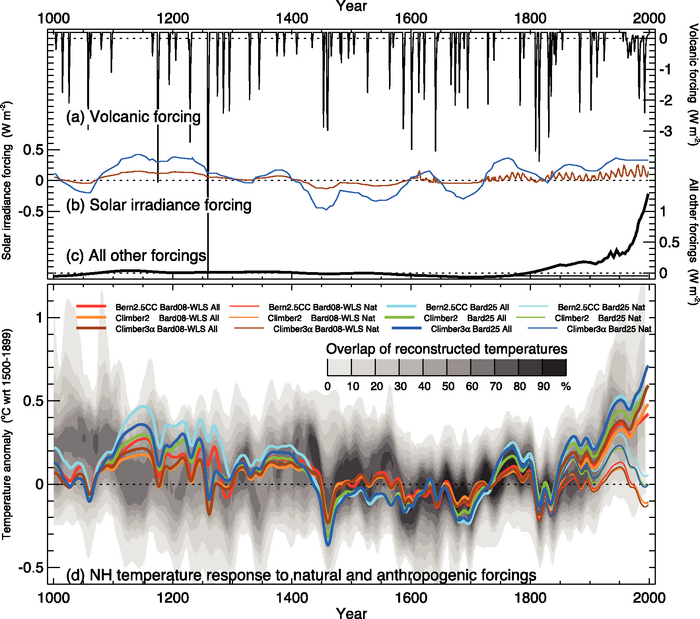
Figure 6.14. Simulated temperatures during the last 1 kyr with and without anthropogenic forcing, and also with weak or strong solar irradiance variations. Global mean radiative forcing (W m–2) used to drive climate model simulations due to (a) volcanic activity, (b) strong (blue) and weak (brown) solar irradiance variations, and (c) all other forcings, including greenhouse gases and tropospheric sulphate aerosols (the thin flat line after 1765 indicates the fixed anthropogenic forcing used in the ‘Nat’ simulations). (d) Annual mean NH temperature (°C) simulated by three climate models under the forcings shown in (a) to (c), compared with the concentration of overlapping NH temperature reconstructions (shown by grey shading, modified from Figure 6.10c to account for the 1500 to 1899 reference period used here). ‘All’ (thick lines) used anthropogenic and natural forcings; ‘Nat’ (thin lines) used only natural forcings. All forcings and temperatures are expressed as anomalies from their 1500 to 1899 means; the temperatures were then smoothed with a Gaussian-weighted filter to remove fluctuations on time scales less than 30 years. Note the different vertical scale used for the volcanic forcing compared with the other forcings. The individual series are identified in Table 6.3 .