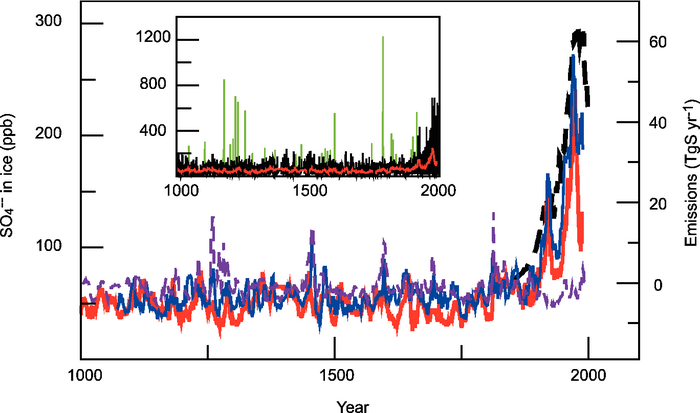
Figure 6.15. Sulphate (SO42–) concentrations in Greenland (Bigler et al., 2002, red line; Mieding, 2005, blue) and antarctic (Traufetter et al., 2004, dash, violet) ice cores during the last millennium. Also shown are the estimated anthropogenic sulphur (S) emissions for the NH (Stern, 2005; dashed black). The ice core data have been smoothed with a 10-year running median filter, thereby removing the peaks of major volcanic eruptions. The inset illustrates the influence of volcanic emissions over the last millennium and shows monthly sulphate data in ppm as measured (green), with identified volcanic spikes removed (black, most recent volcanic events were not assigned nor removed), and results from the 10-year filter (red) (Bigler et al., 2002). The records represent illustrative examples and can be influenced by local deposition events.