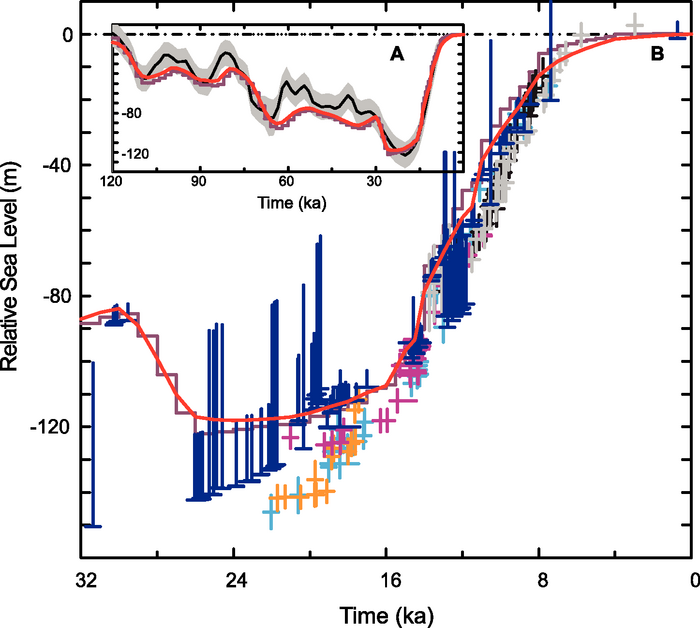
Figure 6.8. (A) The ice-equivalent eustatic sea level history over the last glacial-interglacial cycle according to the analysis of Waelbroeck et al. (2002). The smooth black line defines the mid-point of their estimates for each age and the surrounding hatched region provides an estimate of error. The red line is the prediction of the ICE-5G(VM2) model for the Barbados location for which the RSL observations themselves provide an excellent approximation to the ice-equivalent eustatic sea level curve. (B) The fit of the ICE-5G(VM2) model prediction (red line) to the extended coral-based record of RSL history from the island of Barbados in the Caribbean Sea (Fairbanks, 1989; Peltier and Fairbanks, 2006) over the age range from 32 ka to present. The actual ice-equivalent eustatic sea level curve for this model is shown as the step-discontinuous purple line. The individual coral-based estimates of RSL (blue) have an attached error bar that depends upon the coral species. The estimates denoted by the short error bars are derived from the Acropora palmata species, which provide the tightest constraints upon relative sea level as this species is found to live within approximately 5 m of sea level in the modern ecology. The estimates denoted by the longer error bars are derived either from the Montastrea annularis species of coral (error bars of intermediate 20 m length) or from further species that are found over a wide range of depths with respect to sea level (longest error bars). These additional data are most useful in providing a lower bound for the sea level depression. The data denoted by the coloured crosses are from the ice-equivalent eustatic sea level reconstruction of Lambeck and Chappell (2001) for Barbados (cyan), Tahiti (grey), Huon (black), Bonaparte Gulf (orange) and Sunda Shelf (purple).