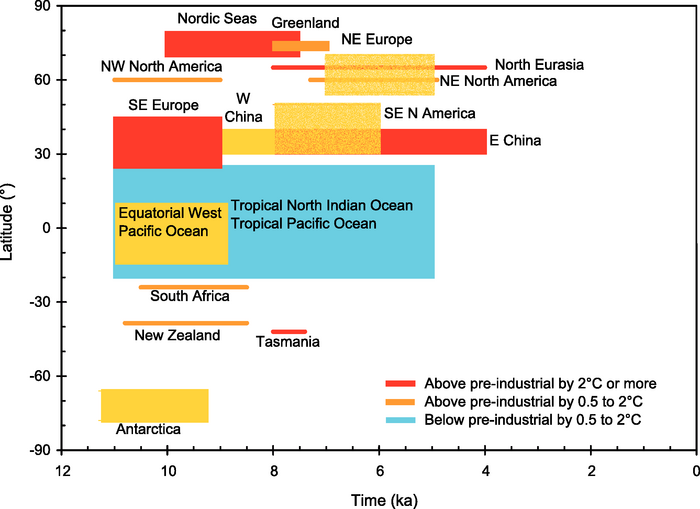
Figure 6.9. Timing and intensity of maximum temperature deviation from pre-industrial levels, as a function of latitude (vertical axis) and time (horizontal axis, in thousands of years before present ). Temperatures above pre-industrial levels by 0.5°C to 2°C appear in orange (above 2°C in red). Temperatures below pre-industrial levels by 0.5°C to 2°C appear in blue. References for data sets are: Barents Sea (Duplessy et al., 2001), Greenland (Johnsen et al., 2001), Europe (Davis et al., 2003), northwest and northeast America (MacDonald et al., 2000; Kaufman et al., 2004), China (He et al., 2004), tropical oceans (Rimbu et al., 2004; Stott et al., 2004; Lorentz et al., 2006), north Atlantic (Marchal et al., 2002; Kim et al., 2004), Tasmania (Xia et al., 2001), East Antarctica (Masson et al., 2000), southern Africa (Holmgren et al., 2003) and New Zealand (Williams et al., 2004).