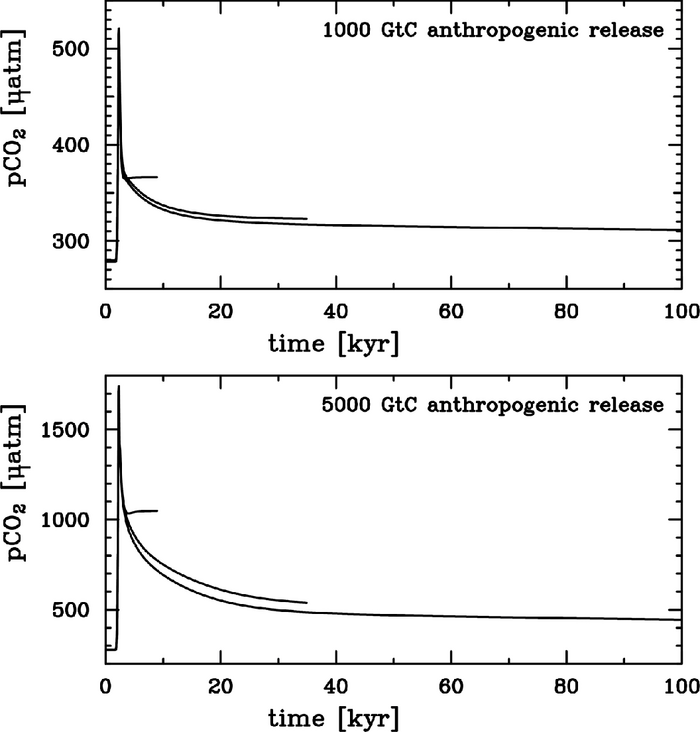
Figure 7.12. Model projections of the neutralization of anthropogenic CO2 for an ocean-only model, a model including dissolution of CaCO3 sediment and a model including weathering of silicate rocks, (top) for a total of 1,000 GtC of anthropogenic CO2 emissions and (bottom) for a total of 5,000 GtC of anthropogenic CO2. Note that the y-axis is different for the two diagrams. Without CaCO3 dissolution from the seafloor, the buffering of anthropogenic CO2 is limited. Even after 100 kyr, the remaining pCO2 is substantially higher than the pre-industrial value. Source: Archer (2005).