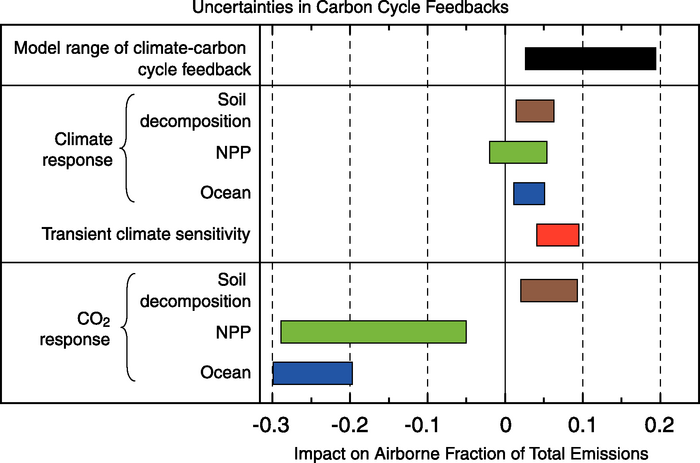
Figure 7.14. Uncertainties in carbon cycle feedbacks estimated from analysis of the results from the C4MIP models. Each effect is given in terms of its impact on the mean airborne fraction over the simulation period (typically 1860 to 2100), with bars showing the uncertainty range based on the ranges of effective sensitivity parameters given in Tables 7.4 and 7.5 . The lower three bars are the direct response to increasing atmospheric CO2 (see Section 7.3.5 for details), the middle four bars show the impacts of climate change on the carbon cycle, and the top black bar shows the range of climate-carbon cycle feedbacks given by the C4MIP models.