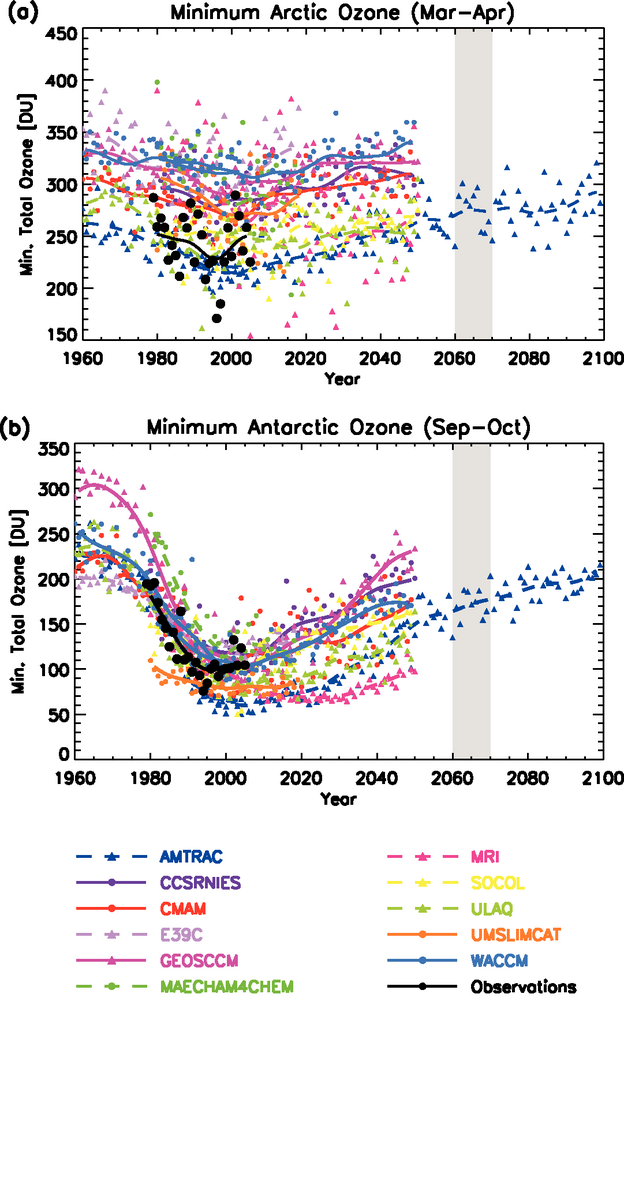
Figure 7.18. (a) Minimum arctic total column ozone for March to April and (b) minimum antarctic total column ozone for September to October (both poleward of 60°) in Dobson Units (DU). Simulations of future evolution of ozone were performed by 11 CCMs analysed as part of the CCM Validation Activity for SPARC (http://www.pa.op.dlr.de/CCMVal/). Model results are compared with values calculated from the National Institute of Water and Atmospheric Research (NIWA) assimilated total column ozone database shown as black dots (Bodeker et al., 2005). The light grey shading between 2060 and 2070 shows the period when halogen amounts in the polar lower stratosphere are expected to return to 1980 values. Models include AMTRAC: Atmospheric Model with Transport and Chemistry; CCSRNIES: Center for Climate System Research - National Institute for Environmental Studies; CMAM: Canadian Middle Atmosphere Model; E39C: German Aerospace Center (DLR) version of ECHAM4 with chemistry and 39 levels; GEOSCCM: Goddard Earth Observing System Chemistry-Climate Model; MAECHAM4/CHEM: Middle Atmosphere ECHAM4 with Chemistry; MRI: Meteorological Research Institute; SOCOL: Solar Climate Ozone Links; ULAQ: University of L’Aquila; UMSLIMCAT: Unified Model SLIMCAT; WACCM: Whole Atmosphere Community Climate Model.