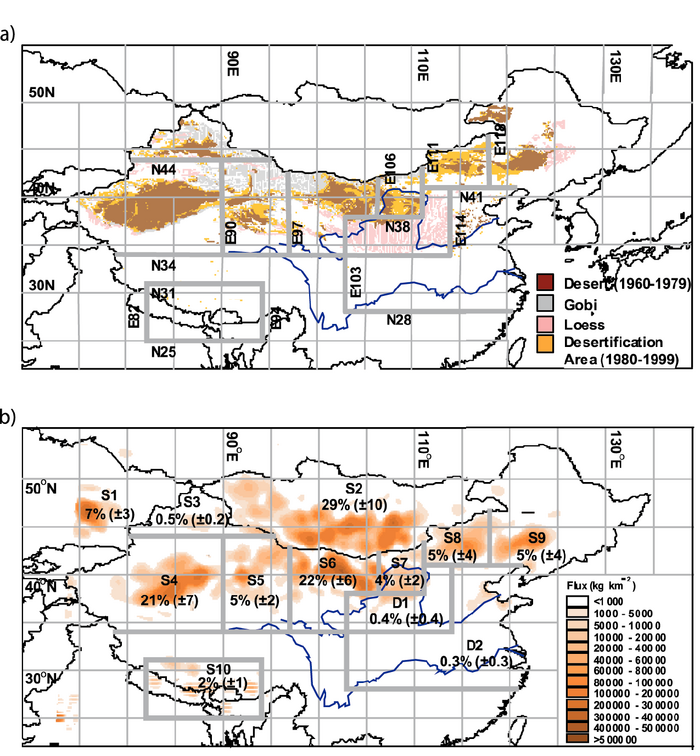
Figure 7.19. (a) Chinese desert distributions from 1960 to 1979 and desert plus desertification areas from 1980 to 1999. (b) Sources (S1 to S10) and typical depositional areas (D1 and D2) for Asian dust indicated by spring average dust emission flux (kg km–2 per month) averaged over 1960 to 2002. The percentages with standard deviations in parentheses denote the average amount of dust production in each source region and the total amount of emissions between 1960 and 2002. The deserts in Mongolia (S2) and in western (S4) and northern (S6) China (mainly the Taklimakan and Badain Juran, respectively) can be considered the major sources of Asian dust emissions. Several areas with more expansions of deserts (S7, S8, S9 and S5) are not key sources. Adapted from Zhang et al. (2003).