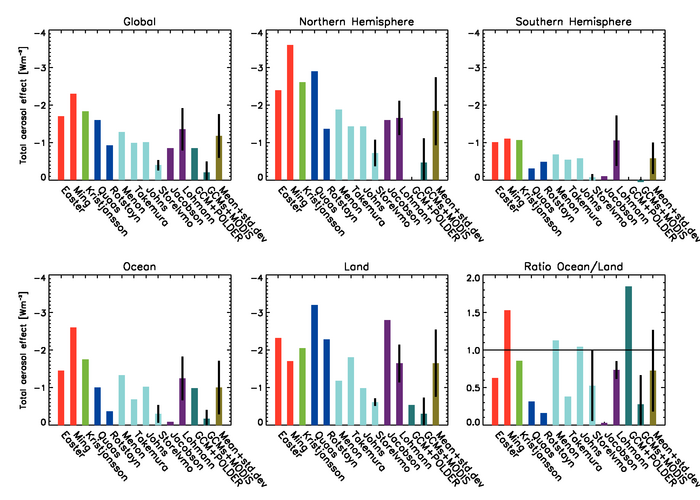
Figure 7.21. Global mean total anthropogenic aerosol effect (direct, semi-direct and indirect cloud albedo and lifetime effects) defined as the response in net radiation at TOA from pre-industrial times to the present day and its contribution over the NH and SH, over oceans and over land, and the ratio over oceans/land. Red bars refer to anthropogenic sulphate (Easter et al., 2004; Ming et al., 2005+), green bars refer to anthropogenic sulphate and black carbon (Kristjánsson, 2002*,+), blue bars to anthropogenic sulphate and organic carbon (Quaas et al., 2004; Rotstayn and Liu, 2005+), turquoise bars to anthropogenic sulphate and black and organic carbon (Menon and Del Genio, 2005; Takemura et al., 2005; Johns et al., 2006; Storelvmo et al., 2006), dark purple bars to anthropogenic sulphate and black and organic carbon effects on water and ice clouds (Jacobson, 2006; Lohmann and Diehl, 2006), teal bars refer to a combination of GCM and satellite results (European Centre for Medium Range Weather Forecasts/Max-Planck Institute for Meteorology Atmospheric GCM (ECHAM) plus Polarisation and Directionality of the Earth’s Reflectance (POLDER), Lohmann and Lesins, 2002; Laboratoire de Météorologie Dynamique GCM (LMDZ)/ECHAM plus Moderate Resolution Imaging Spectroradiometer (MODIS), Quaas et al., 2006) and olive bars to the mean and standard deviation from all simulations. Vertical black lines for individual results refer to ±1 standard deviation in cases of multiple simulations and/or results.
* refers to estimates of the aerosol effect deduced from the shortwave radiative flux only
+ refers to estimates solely from the indirect effects