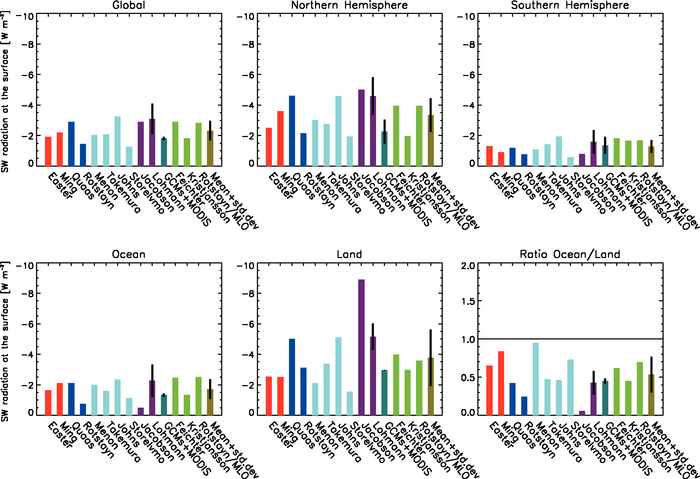
Figure 7.23. Global mean change in net solar radiation at the surface due to the total anthropogenic aerosol effect (direct, semi-direct and indirect cloud albedo and lifetime effects) from pre-industrial times to the present day and its contribution over the NH and SH, over oceans and over land and the ratio over oceans/land. Red bars refer to anthropogenic sulphate (Easter et al., 2004; Ming et al., 2005+), blue bars to anthropogenic sulphate and organic carbon (Quaas et al., 2004; Rotstayn and Liu, 2005+), turquoise bars to anthropogenic sulphate and black and organic carbon (Menon and Del Genio, 2005; Takemura et al., 2005; Johns et al., 2006; Storelvmo et al., 2006), dark purple bars to anthropogenic sulphate and black and organic carbon effects on water and ice clouds (Jacobson, 2006; Lohmann and Diehl, 2006), teal bars refer to a combination of GCM and satellite results (LMDZ/ECHAM plus MODIS, Quaas et al., 2006), green bars refer to results from coupled atmosphere/mixed-layer ocean (MLO) experiments (Feichter et al., 2004: sulphate and black and organic carbon; Kristjansson et al., 2005: sulphate and black carbon; Rotstayn and Lohmann, 2002+: sulphate only) and olive bars to the mean from all simulations. Vertical black lines refer to ±1 standard deviation.
+ refers to estimates solely from the indirect effects