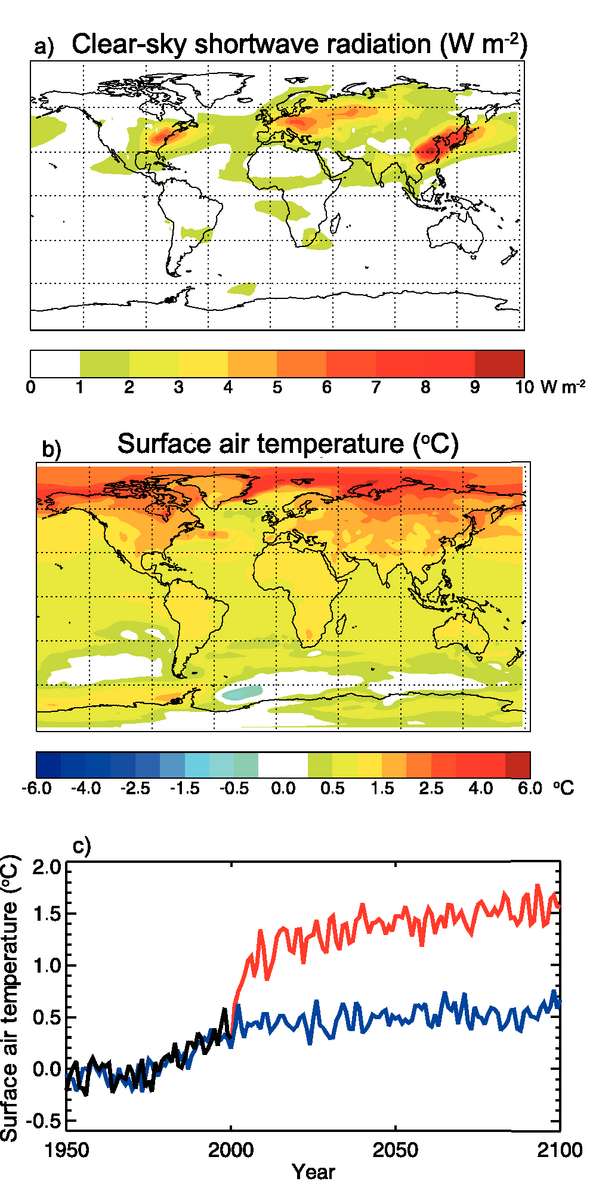
Figure 7.24. Effect of removing the entire burden of sulphate aerosols in the year 2000 on (a) the annual mean clear sky TOA shortwave radiation (W m–2) calculated by Brasseur and Roeckner (2005) for the time period 2071 to 2100 and (b) on the annual mean surface air temperature (°C) calculated for the same time period. (c) temporal evolution of global and annual mean surface air temperature anomalies (°C) with respect to the mean 1961 to 1990 values. The evolution prior to the year 2000 is driven by observed atmospheric concentrations of greenhouse gases and aerosols as adopted by IPCC (see Chapter 10 ). After 2000, the concentration of greenhouse gases remains constant while the aerosol burden is unchanged (blue line) or set to zero (red line). The black curve shows observations (A. Jones et al., 2001; Jones et al., 2006).