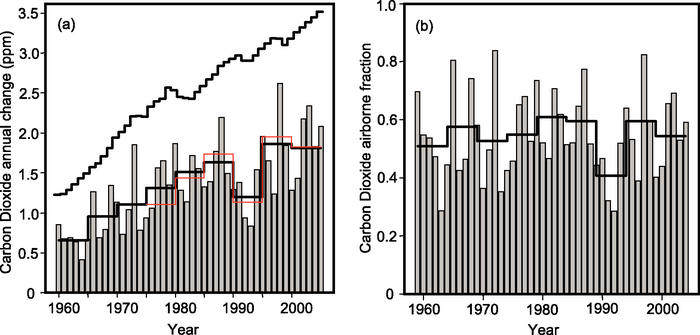
Figure 7.4. Changes in global atmospheric CO2 concentrations. (a) Annual (bars) and five-year mean (lower black line) changes in global CO2 concentrations, from Scripps Institution of Oceanography observations (mean of South Pole and Mauna Loa; Keeling and Whorf, 2005, updated). The upper stepped line shows annual increases that would occur if 100% of fossil fuel emissions (Marland et al., 2006, updated as described in Chapter 2 ) remained in the atmosphere, and the red line shows five-year mean annual increases from National Oceanic and Atmospheric Administration (NOAA) data (mean of Samoa and Mauna Loa; Tans and Conway, 2005, updated). (b) Fraction of fossil fuel emissions remaining in the atmosphere (‘airborne fraction’) each year (bars), and five-year means (solid black line) (Scripps data) (mean since 1958 is 0.55). Note the anomalously low airborne fraction in the early 1990s.