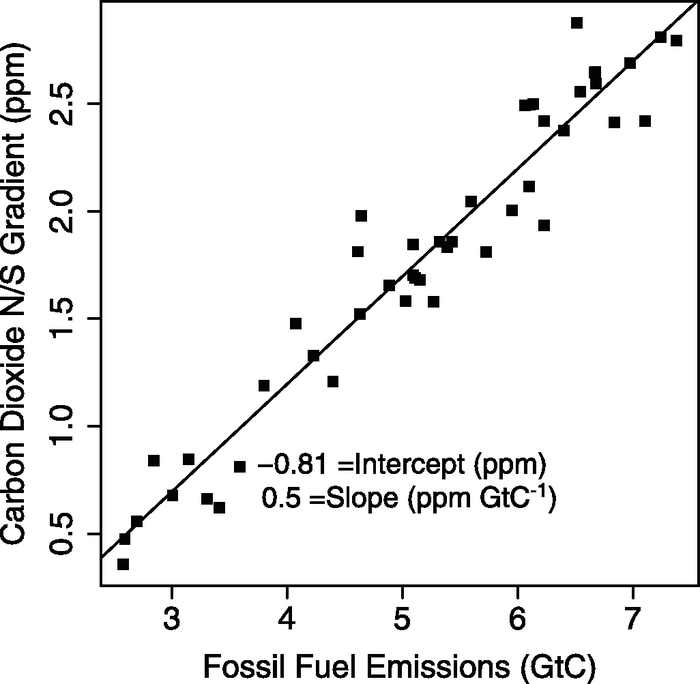
Figure 7.5. The difference between CO2 concentration in the NH and SH (y axis), computed as the difference between annual mean concentrations (ppm) at Mauna Loa and the South Pole (Keeling and Whorf, 2005, updated), compared with annual fossil fuel emissions (x axis; GtC; Marland, et al., 2006), with a line showing the best fit. The observations show that the north-south difference in CO2 increases proportionally with fossil fuel use, verifying the global impact of human-caused emissions.