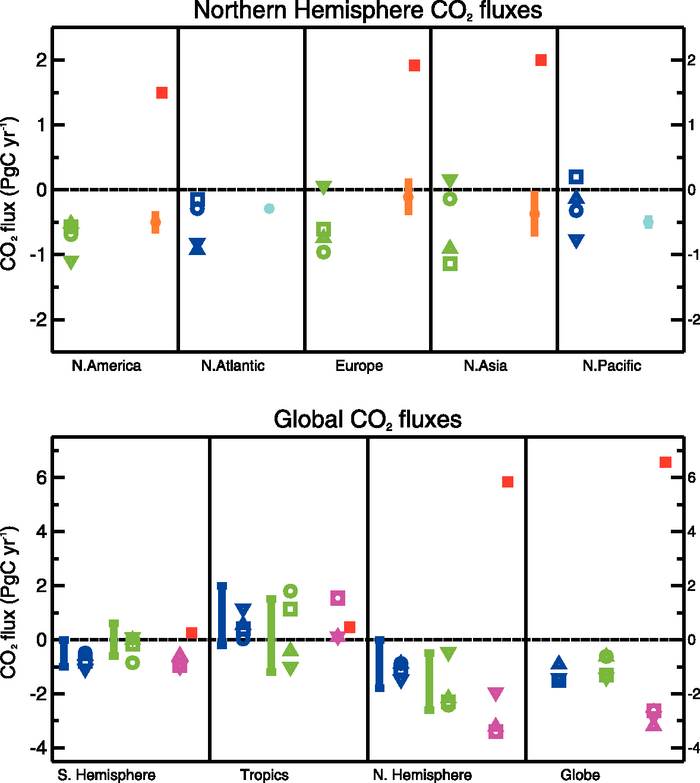
Figure 7.7. Regional ocean-atmosphere and land-atmosphere CO2 fluxes for the NH (top) and the globe (bottom) from inversion ensembles and bottom-up studies. Fluxes to the atmosphere are positive and uptake has a negative sign. Inversion results all correspond to the post-Pinatubo period 1992 to 1996. Orange: Bottom-up terrestrial fluxes from Pacala et al. (2001) and Kurz and Apps (1999) for North America, from Janssens et al. (2003) for Europe and from Shvidenko and Nilsson (2003) plus Fang et al. (2001) for North Asia (Asian Russia and China). Cyan (filled circles): Bottom-up ocean flux estimates from Takahashi, et al. (2002). Blue: ocean fluxes from atmospheric inversions. Green: terrestrial fluxes from inversion models. Magenta: total inversion fluxes. Red: fossil fuel emissions. The mean flux of different inversion ensembles is reported. Inversion errors for regional fluxes are not reported here; their values usually range between 0.5 and 1 GtC yr–1. Error bar: range of atmospheric inversion fluxes from the TAR. Squares: Gurney et al. (2002) inversions using annual mean CO2 observations and 16 transport models. Circles: Gurney et al. (2003) inversions using monthly CO2 observations and 13 transport models. Triangles: Peylin et al. (2005) inversions with three transport models, three regional breakdowns and three inversion settings. Inverted triangles: Rödenbeck et al. (2003a) inversions where the fluxes are solved on the model grid using monthly flask data.