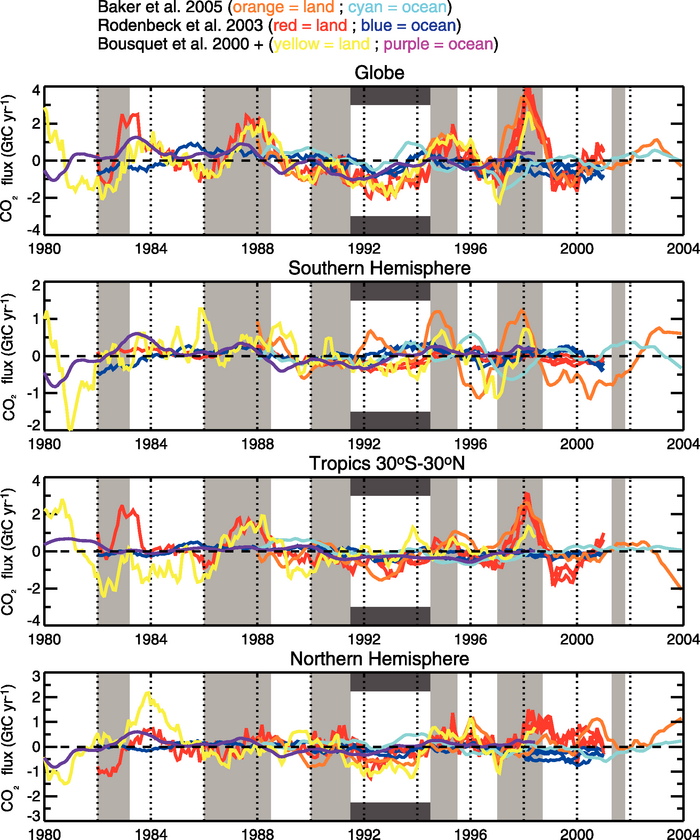
Figure 7.9. Year-to-year anomalies in ocean-atmosphere and land-atmosphere CO2 fluxes (GtC yr–1) from interannual inversion ensembles covering the past 20 years or so, grouped into large latitude bands, and over the globe. Three different inversion ensembles from Bousquet et al. (2000), Rödenbeck et al. (2003a) and Baker et al. (2006) are shown. For each flux and each region, the anomalies were obtained by subtracting the long-term mean flux and removing the seasonal signal. Grey shaded regions indicate El Niño episodes, and the black bars indicate the cooling period following the Mt. Pinatubo eruption.