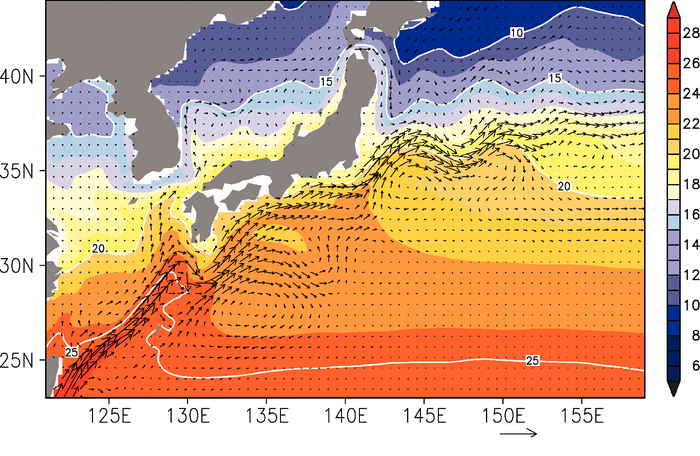
Figure 8.1. Long-term mean ocean current velocities at 100 m depth (vectors, unit: m s–1) and sea surface temperature (colours, °C) around the Kuroshio and the Kuroshio Extension obtained from a control experiment forced by pre-industrial conditions (CO2 concentration 295.9 ppm) using MIROC3.2 (hires).