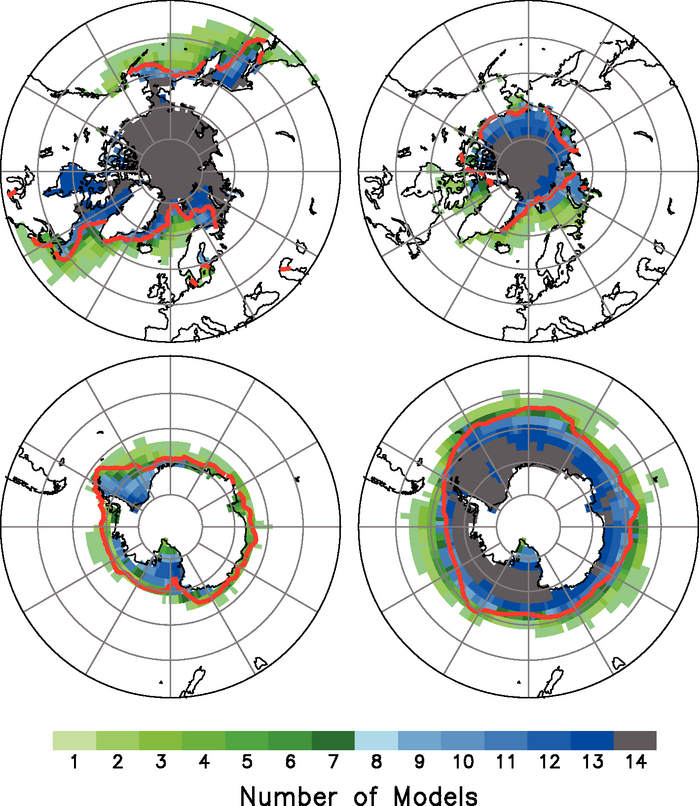
Figure 8.10. Baseline climate (1980–1999) sea ice distribution in the Northern Hemisphere (upper panels) and Southern Hemisphere (lower panels) simulated by 14 of the AOGCMs listed in Table 8.1 for March (left) and September (right), adapted from Arzel et al. (2006). For each 2.5° x 2.5° longitude-latitude grid cell, the figure indicates the number of models that simulate at least 15% of the area covered by sea ice. The observed 15% concentration boundaries (red line) are based on the Hadley Centre Sea Ice and Sea Surface Temperature (HadISST; Rayner et al., 2003) data set.