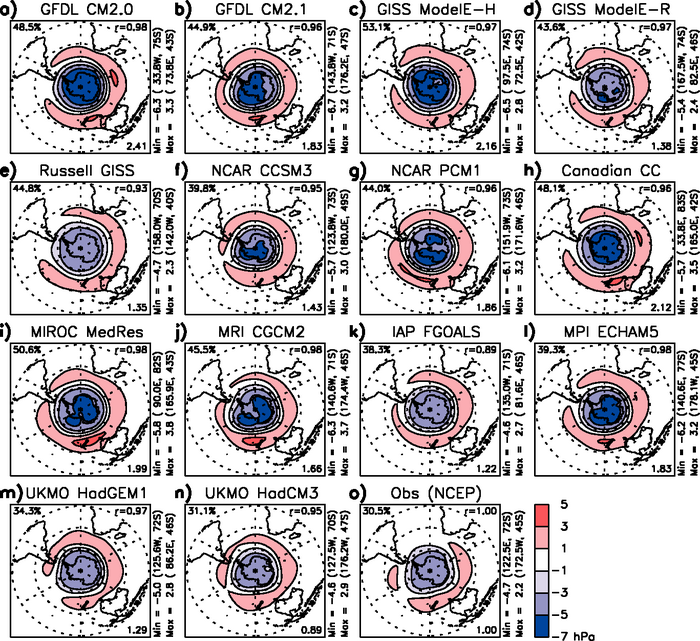
Figure 8.12. Ensemble mean leading Empirical Orthogonal Function (EOF) of summer (November through February) Southern Hemisphere sea level pressure (hPa) for 1950 to 1999. The EOFs are scaled so that the associated principal component has unit variance over this period. The percentage of variance accounted for by the leading mode is listed at the upper left corner of each panel. The spatial correlation (r) with the observed pattern is given at the upper right corner. At the lower right is the ratio of the EOF spatial variance to the observed value. “Canadian CC” refers to CGCM3.1 (T47), and “Russell GISS” refers to the GISS AOM. Adapted from Miller et al. (2006).