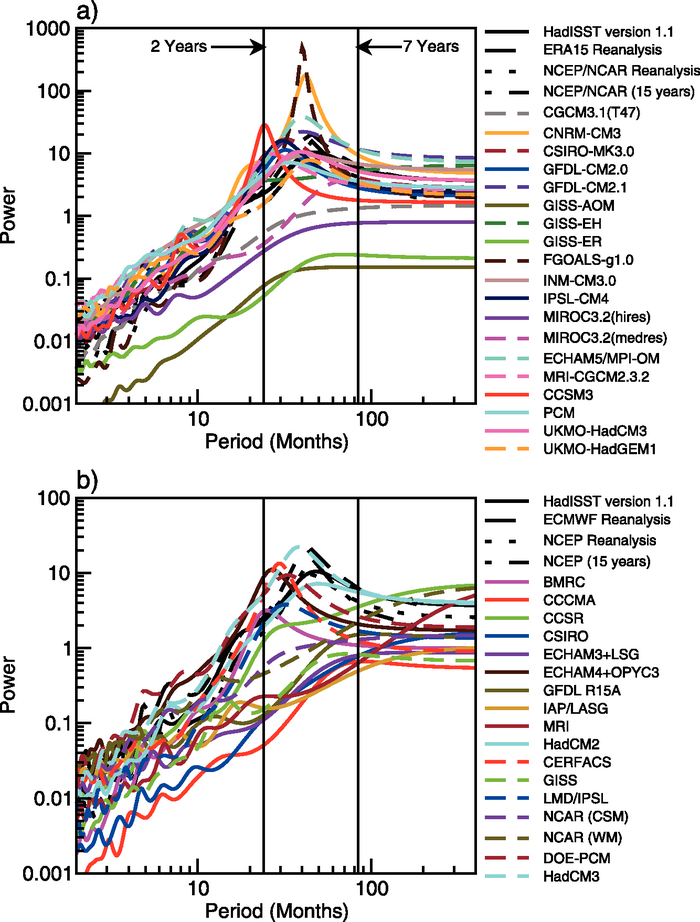
Figure 8.13. Maximum entropy power spectra of surface air temperature averaged over the NINO3 region (i.e., 5°N to 5°S, 150°W to 90° W) for (a) the MMD at the PCMDI and (b) the CMIP2 models. Note the differing scales on the vertical axes and that ECMWF reanalysis in (b) refers to the European Centre for Medium Range Weather Forecasts (ECMWF) 15-year reanalysis (ERA15) as in (a). The vertical lines correspond to periods of two and seven years. The power spectra from the reanalyses and for SST from the Hadley Centre Sea Ice and Sea Surface Temperature (HadISST) version 1.1 data set are given by the series of solid, dashed and dotted black curves. Adapted from AchutaRao and Sperber (2006).