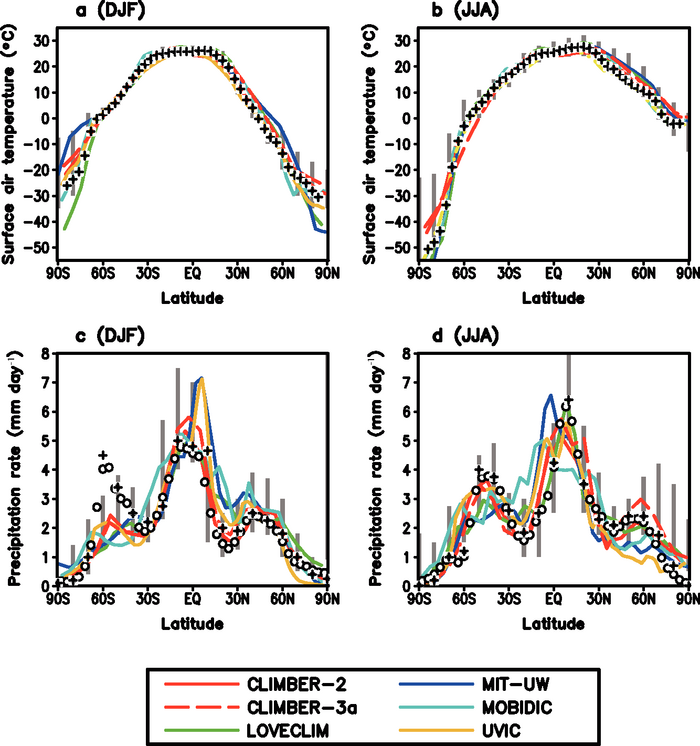
Figure 8.17. Latitudinal distributions of the zonally averaged surface air temperature (a, b) and precipitation rate (c, d) for boreal winter (DJF) (a, c) and boreal summer (JJA) (b, d) as simulated at equilibrium by some of the EMICs used in Chapter 10 (see Table 8.3 ) for an atmospheric CO2 concentration of 280 ppm. In (a) and (b), observational data merged from Jennings (1975), Jones (1988), Schubert et al. (1992), da Silva et al. (1994) and Fiorino (1997) are shown by crosses. In (c) and (d), observation-based estimates from Jaeger (1976; crosses) and Xie and Arkin (1997; open circles) are shown. The vertical grey bars indicate the range of GCM results from AMIP and CMIP1 (see text). Note that the model versions used in this intercomparison have no interactive biosphere and ice sheet components. The MIT-UW model is an earlier version of MIT-IGSM2.3. Adapted from Petoukhov et al., 2005.