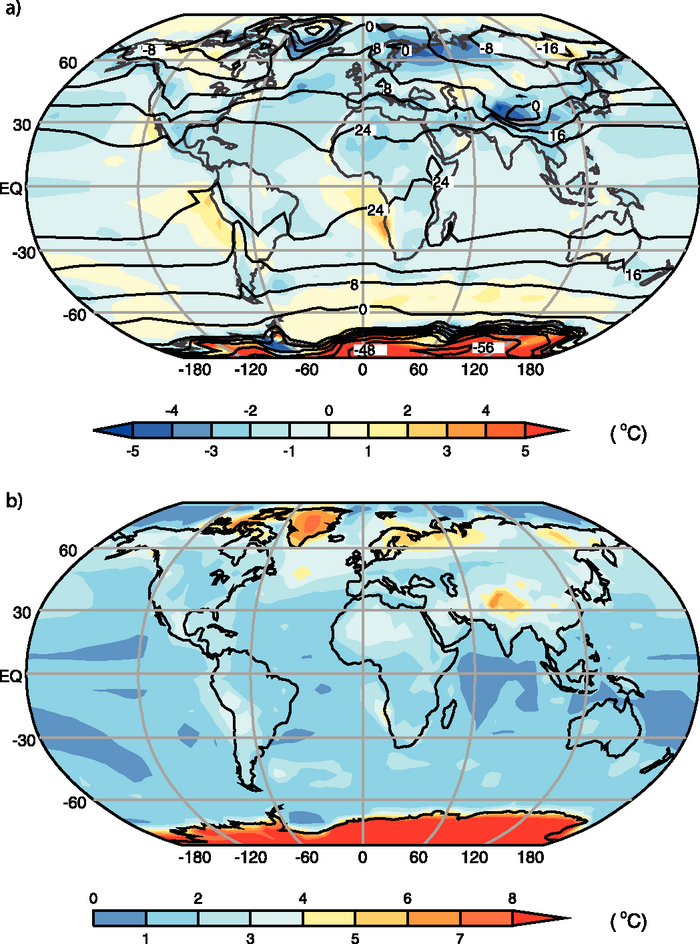
Figure 8.2. (a) Observed climatological annual mean SST and, over land, surface air temperature (labelled contours) and the multi-model mean error in these temperatures, simulated minus observed (colour-shaded contours). (b) Size of the typical model error, as gauged by the root-mean-square error in this temperature, computed over all AOGCM simulations available in the MMD at PCMDI. The Hadley Centre Sea Ice and Sea Surface Temperature (HadISST; Rayner et al., 2003) climatology of SST for 1980 to 1999 and the Climatic Research Unit (CRU; Jones et al., 1999) climatology of surface air temperature over land for 1961 to 1990 are shown here. The model results are for the same period in the 20th-century simulations. In the presence of sea ice, the SST is assumed to be at the approximate freezing point of seawater (–1.8°C). Results for individual models can be seen in the Supplementary Material, Figure S8.1.