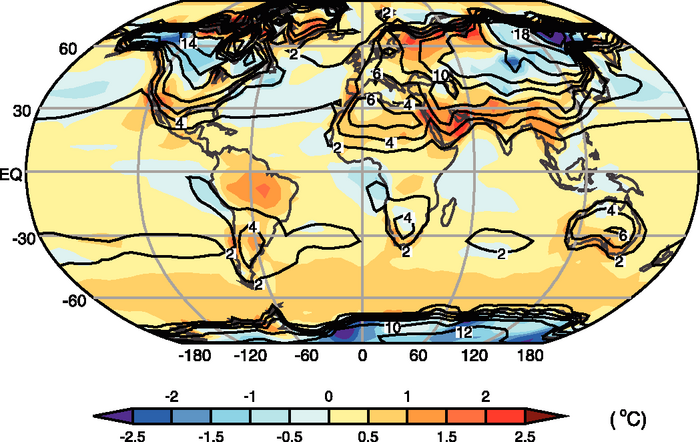
Figure 8.3. Observed standard deviation (labelled contours) of SST and, over land, surface air temperature, computed over the climatological monthly mean annual cycle, and the multi-model mean error in the standard deviations, simulated minus observed (colour-shaded contours). In most regions, the standard deviation provides a measure of the amplitude of the seasonal range of temperature. The observational data sets, the model results and the climatological periods are as described in Figure 8.2. Results for individual models can be seen in the Supplementary Material, Figure S8.2.