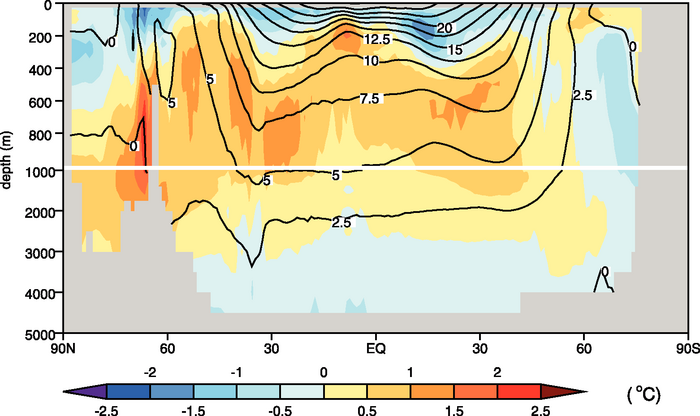
Figure 8.9. Time-mean observed potential temperature (°C), zonally averaged over all ocean basins (labelled contours) and multi-model mean error in this field, simulated minus observed (colour-filled contours). The observations are from the 2004 World Ocean Atlas compiled by Levitus et al. (2005) for the period 1957 to 1990, and the model results are for the same period in the 20th-century simulations in the MMD at PCMDI. Results for individual models can be seen in the Supplementary Material, Figure S8.12.